The Mystery of the Missing Main Flow: Building a Centralized Observability Stack
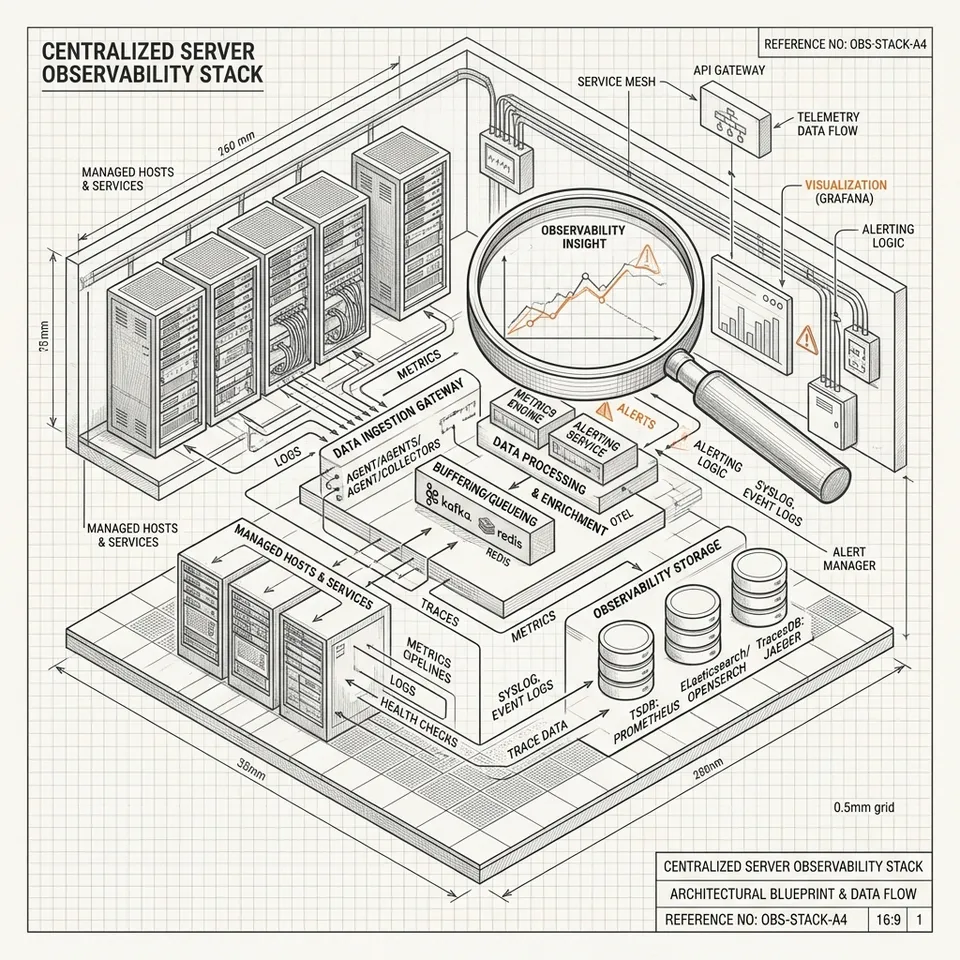
Server downtime is rarely just about what is broken; it is usually about how fast you can find what is broken.
A while ago, we encountered an anomaly. The system didn't crash completely, but users reported that the application's main flow was broken. The worst part was that it was intermittent. Sometimes it succeeded, and sometimes it failed. In the world of software engineering, this is the worst kind of curse.
This is the story of how one confusing incident completely changed the way we monitor our applications.
Chapter 1: Finding a Needle in a Haystack
When the reports came in, our first instinct was naturally to check the logs. However, our multi-server legacy architecture turned this process into a scene from an amateur detective movie.
We had to SSH into each individual server, tail the application logs, attempt to reproduce the issue, and pray that an error message would appear on the screen. As user traffic grew, our terminals were flooded with thousands of lines of rolling text. Trying to find the root cause in this chaos felt like searching for a needle in a haystack while blindfolded.
An investigation that should have taken minutes dragged on for hours. The main flow was paralyzed, and the team was in panic mode.
Chapter 2: The Unexpected Suspect
After an exhausting cross-server manhunt, we finally identified the primary "suspect."
As it turned out, our infrastructure team had been performing routine maintenance on one of our on-premise servers. This activity inadvertently caused issues with certain database tables. Whenever the application attempted a transaction on those specific tables at the exact moment of maintenance, the transaction failed (hence the intermittent nature of the bug).
This discovery was a harsh wake-up call. The maintenance just exposed our real problem: we were completely blind. We shouldn't have to play detective and kick down every door (server) just to find one broken window.
Chapter 3: The Weapon That Backfired
We were determined to fix our visibility problem. Prior to the incident, we had almost no application-level logging, just standard, non-detailed standard output that offered zero clues during a crisis. We were essentially flying blind.
Post-incident, we immediately implemented detailed logging across our services. Initially, we configured the application to write all these new, rich logs directly into a physical file (app.log).
On paper, this made perfect sense. In reality, it was a ticking time bomb. When user traffic spiked, the intense file I/O operations from writing detailed logs to disk overwhelmed the server resources. We had inadvertently created a massive bottleneck. The very weapon we forged to monitor the system was now suffocating it.
We had to execute a rapid pivot. We moved all the detailed logging back to stdout (managed by the OS service manager, like systemd). The application no longer had to manage file writing; it simply "shouted" its detailed logs to the console, allowing a dedicated external agent to listen in without impacting application performance.
Chapter 4: The Central Command
To capture these logs and monitor our entire multi-server infrastructure, we built a centralized "command center." We found an underutilized legacy server in our on-premise environment that was still running but barely doing any work. It was the perfect candidate to be resurrected for a much nobler purpose.
Because our legacy environments had not yet adopted modern containerization tools like Docker, setting up this command center wasn't a simple matter of running docker-compose up. We accepted the gritty reality of our infrastructure and deployed the entire observability stack natively. This meant configuring systemd services manually, handling OS-level user permissions, and opening firewall ports across multiple legacy servers to allow communication.
Our new arsenal consisted of four main pillars:
- Prometheus: The metric gatherer. We deployed various native exporters across our infrastructure:
node_exporterfor server health (CPU, RAM, disk I/O), MySQL exporter to monitor database locks and slow queries, and Apache exporter for web server request rates. - Promtail: The intelligence agent. Installed directly onto the OS of every service server, Promtail was configured to read the
stdoutstreams from oursystemdservices and ship them centrally over the network. - Loki: The central archive. A highly efficient database dedicated to storing and indexing all the log streams pushed by our scattered Promtail agents.
- Grafana: The ultimate dashboard. The single pane of glass where data from both Prometheus and Loki is visualized side-by-side.
This native, manual setup took effort, but the payoff was immediate. We didn't just stop at monitoring system metrics. We pushed Grafana further by injecting Business Metrics.
For the first time, we could view system health and business health on the exact same screen. Alongside CPU and RAM usage, we could now track the number of daily transactions, count active users, and monitor the most frequently used processes in real-time.
This was our "Eureka" moment. If a CPU spike occurred on a specific server, we could instantly correlate it with a drop in daily transactions, and with one click, pull up the exact Loki logs from that specific minute. What used to be a fragmented, blind legacy system was now a fully illuminated, unified ecosystem.
Chapter 5: Case Closed
Today, when an alert goes off, there is no more scrambling. We don't blindly SSH into ten different servers anymore.
We simply open Grafana, observe the error spikes from Prometheus metrics, and run a quick query in Loki to see the exact application logs from the very second the incident occurred.
That grueling on-premise maintenance incident taught us one thing: Having a fleet of servers means absolutely nothing if you are left guessing when things go wrong. Centralized observability isn't just a "nice-to-have" feature; it is the foundation for an engineer's peace of mind.